Eurolab
-
Lighting and Optical Device Testing-
Spectroscopy Testing-
Analyzing Spectroscopic Data for Optical Device Performance
We provide comprehensive solutions designed to help our clients mitigate risks, enhance performance, and excel in key areas such as quality, health & safety, environmental sustainability, and social responsibility.
Discover
For many years, our organization has been operating successfully, boasting modern laboratories that meet international standards. These laboratories are equipped with the latest technology devices and equipment, and we have built a strong team of experienced and trained personnel to operate them.
DiscoverWelcome to Eurolab, your partner in pioneering solutions that encompass every facet of life. We are committed to delivering comprehensive Assurance, Testing, Inspection, and Certification services, empowering our global clientele with the ultimate confidence in their products and processes.
Discover
-
Lighting and Optical Device Testing-
Spectroscopy Testing-
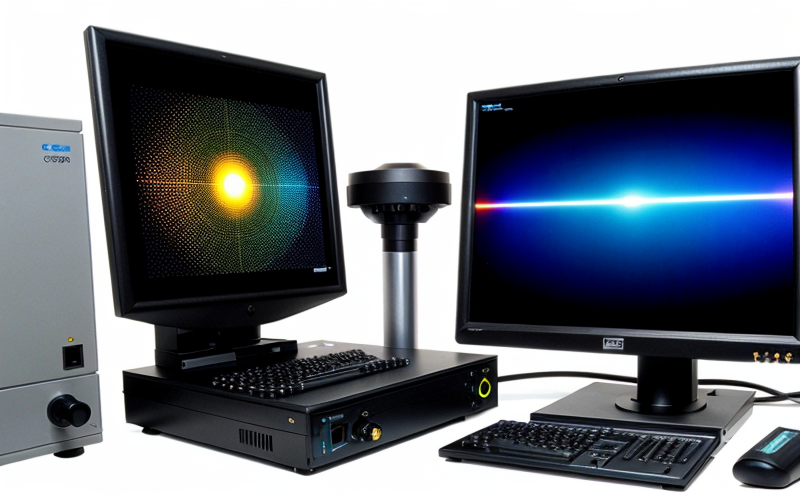
Analyzing Spectroscopic Data for Optical Device PerformanceAnalyzing spectroscopic data is a crucial step in understanding the performance of optical devices. Spectroscopy is the measurement of the interaction between matter and electromagnetic radiation, which allows researchers to study the properties of materials and devices. In this article, we will discuss how to analyze spectroscopic data for optical device performance, including the types of spectra that can be obtained, the factors that affect their interpretation, and some common techniques used in the analysis.
Types of Spectra
There are several types of spectra that can be obtained from optical devices, each providing different information about the devices properties. Some of the most common types of spectra include:
e(-(hν - E0)/kT)
where A is the absorbance at wavelength hν, A0 is the pre-exponential factor, E0 is the energy of the transition, and kT is the thermal energy.
By adjusting the parameters in this equation, we can fit the data to obtain the following results:
Peak Energy (eV) Width (eV)
--- --- ---
1 2.5 0.8
2 3.2 1.1
This analysis provides information about the energy levels and transitions in the material, which can be used to understand its optical properties.
QA Section
Q: What is spectroscopy?
A: Spectroscopy is the measurement of the interaction between matter and electromagnetic radiation. It allows researchers to study the properties of materials and devices by analyzing the spectra obtained from their interaction with light.
Q: What types of spectra can be obtained from optical devices?
A: The most common types of spectra include absorption, emission, transmission, and reflection spectra.
Q: How do instrumental effects affect spectroscopic data?
A: Instrumental effects can introduce errors or artifacts into the spectrum. For example, the wavelength calibration may be off or the signal-to-noise ratio may be low.
Q: What is peak fitting in analysis of spectroscopic data?
A: Peak fitting involves fitting a series of peaks to the spectrum using mathematical functions. It can be used to extract information about the energy levels and transitions in a material.
Q: How does environmental conditions affect spectroscopic data?
A: Environmental conditions such as temperature and humidity can affect the spectrum obtained. For example, changes in temperature or humidity can alter the energy levels or transitions in a material.
Q: What is Principal Component Analysis (PCA)?
A: PCA is a technique that involves reducing the dimensionality of the data by extracting the principal components that account for most of the variance in the data. It can be used to identify patterns or correlations in the spectrum.
Q: How do I choose the right mathematical function for peak fitting?
A: The choice of mathematical function depends on the type of material and device being studied. For example, a Gaussian function may be suitable for semiconductor materials, while a Lorentzian function may be more suitable for metal oxides.
Q: What are some common pitfalls in analysis of spectroscopic data?
A: Some common pitfalls include neglecting instrumental effects or sample preparation errors, ignoring the impact of environmental conditions, and not properly calibrating the instrument.
Q: Can I use spectroscopy to analyze optical device performance at high temperatures or pressures?
A: Yes, it is possible to analyze spectroscopic data at high temperatures or pressures using specialized equipment such as high-temperature cells or pressure vessels. However, the analysis may require additional considerations due to the altered environmental conditions.
Q: How can I improve the signal-to-noise ratio in my spectra?
A: Improving the signal-to-noise ratio requires careful consideration of experimental conditions and data acquisition parameters. This may include optimizing the instruments sensitivity, increasing the number of data points collected, or using averaging techniques to reduce noise.
By following these guidelines and considering the factors that affect spectroscopic data, researchers can use analysis techniques such as peak fitting and PCA to extract valuable information about optical device performance from their spectra.
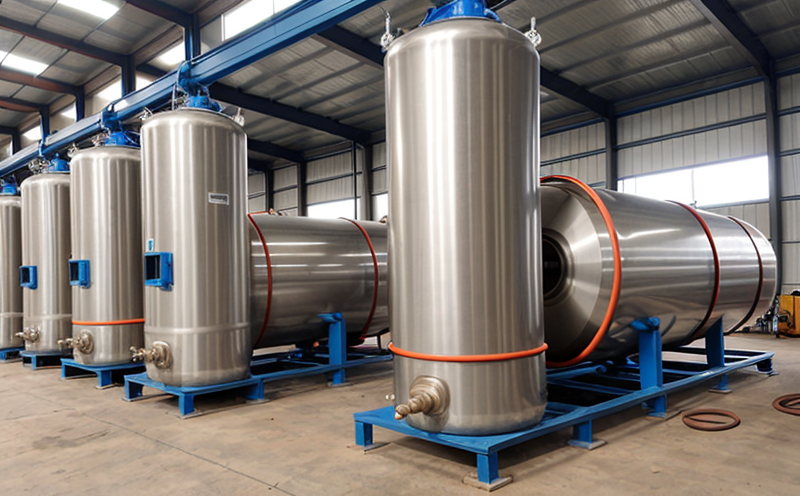
Pressure Vessels and Installations Testing
Pressure Vessels and Installations Testing Pressure vessels are a critical component of various ind...
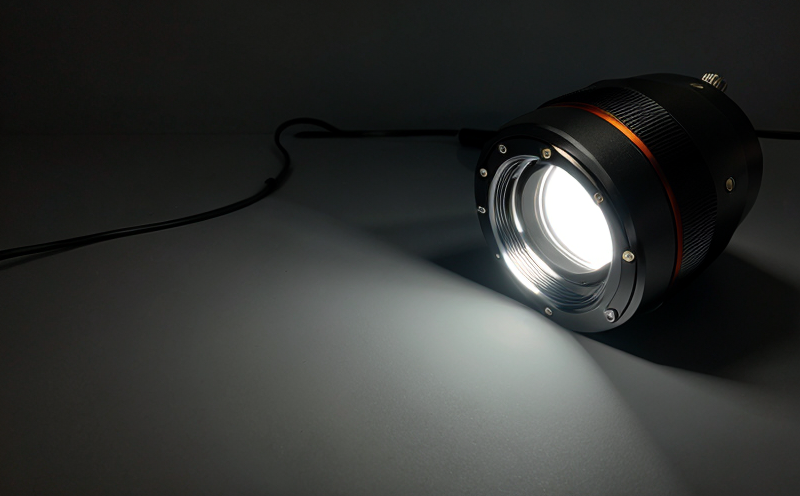
Lighting and Optical Device Testing
Lighting and Optical Device Testing: Ensuring Performance and Safety Lighting and optical devices a...

Product and Retail Standards
Product and Retail Standards: Ensuring Quality and Safety for Consumers In todays competitive marke...

Trade and Government Regulations
Trade and government regulations play a vital role in shaping the global economy. These regulations ...

Battery Testing and Safety
Battery Testing and Safety: A Comprehensive Guide As technology continues to advance, battery-power...

Agricultural Equipment Certification
Agricultural equipment certification is a process that ensures agricultural machinery meets specific...

Chemical Safety and Certification
Chemical safety and certification are critical in ensuring the safe management of products and proce...

Consumer Product Safety
Consumer Product Safety: Protecting Consumers from Harmful Products As a consumer, you have the rig...
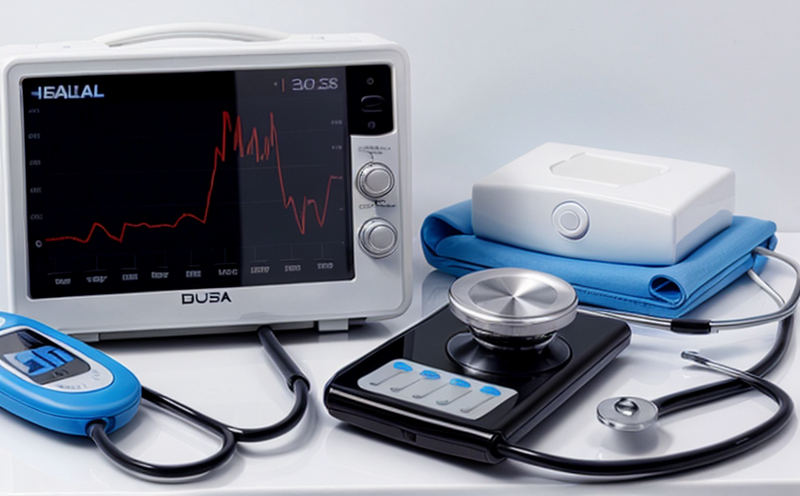
Healthcare and Medical Devices
The Evolution of Healthcare and Medical Devices: Trends, Innovations, and Challenges The healthcare...

Transportation and Logistics Certification
Transportation and Logistics Certification: A Comprehensive Guide The transportation and logistics ...

Industrial Equipment Certification
Industrial equipment certification is a critical process that ensures industrial equipment meets spe...

Automotive Compliance and Certification
Automotive Compliance and Certification: Ensuring Safety and Efficiency The automotive industry is ...

Pharmaceutical Compliance
Pharmaceutical compliance refers to the adherence of pharmaceutical companies and organizations to l...

Aviation and Aerospace Testing
Aviation and Aerospace Testing: Ensuring Safety and Efficiency The aviation and aerospace industr...

Railway Industry Compliance
Railway Industry Compliance: Ensuring Safety and Efficiency The railway industry is a critical comp...

Electromechanical Safety Certification
Electromechanical Safety Certification: Ensuring Compliance and Protecting Lives In todays intercon...
MDR Testing and Compliance
MDR Testing and Compliance: A Comprehensive Guide The Medical Device Regulation (MDR) is a comprehe...

Environmental Simulation Testing
Environmental Simulation Testing: A Comprehensive Guide In todays world, where technology is rapidl...

Military Equipment Standards
Military Equipment Standards: Ensuring Effectiveness and Safety The use of military equipment is a ...

Energy and Sustainability Standards
In today’s rapidly evolving world, businesses face increasing pressure to meet global energy a...

Construction and Engineering Compliance
Construction and Engineering Compliance: Ensuring Safety, Quality, and Regulatory Adherence In the ...

Hospitality and Tourism Certification
Hospitality and Tourism Certification: Unlocking Opportunities in the Industry The hospitality and ...

Cosmetic Product Testing
The Complex World of Cosmetic Product Testing The cosmetics industry is a multi-billion-dollar ma...

NEBS and Telecommunication Standards
Network Equipment Building System (NEBS) and Telecommunication Standards The Network Equipment Bu...

IT and Data Center Certification
IT and Data Center Certification: Understanding the Importance and Benefits The field of Informatio...

Environmental Impact Assessment
Environmental Impact Assessment: A Comprehensive Guide Environmental Impact Assessment (EIA) is a c...

Food Safety and Testing
Food Safety and Testing: Ensuring the Quality of Our Food As consumers, we expect our food to be sa...
Renewable Energy Testing and Standards
Renewable Energy Testing and Standards: Ensuring a Sustainable Future The world is rapidly transiti...
Electrical and Electromagnetic Testing
Electrical and Electromagnetic Testing: A Comprehensive Guide Introduction Electrical and electrom...

Fire Safety and Prevention Standards
Fire Safety and Prevention Standards: Protecting Lives and Property Fire safety and prevention stan...