Frequency Spectrum Analysis: Understanding and Applying its Power
In todays world, where technology has advanced to unprecedented levels, data collection and analysis have become increasingly important for various industries such as healthcare, finance, and telecommunications. One of the key concepts in data analysis is Frequency Spectrum Analysis (FSA), which has numerous applications in various fields. In this article, we will delve into the concept of FSA, its importance, and its applications.
What is Frequency Spectrum Analysis?
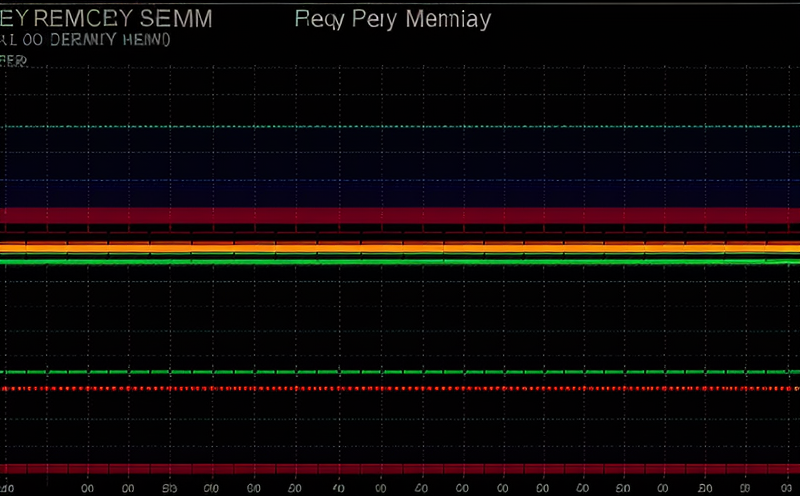
Frequency Spectrum Analysis is a mathematical tool used to decompose a time series or signal into its constituent frequencies. It involves breaking down a complex signal into simpler components, which can then be analyzed individually. The output of FSA is typically presented as a graphical representation called the frequency spectrum, where the x-axis represents the frequency and the y-axis represents the amplitude (or intensity) of each frequency component.
FSA has its roots in physics and engineering, particularly in the study of waveforms and vibrations. In essence, its an extension of the Fourier Transform, a mathematical technique developed by Joseph Fourier that allows us to decompose a signal into its constituent frequencies. The Fourier Transform is a fundamental concept in many fields, including signal processing, image analysis, and data compression.
Key Concepts and Principles
Before we dive deeper into FSA, its essential to understand some key concepts:
Signal: A time series or waveform that represents the data.
Frequency: The number of oscillations per second, measured in Hertz (Hz).
Amplitude: The intensity or magnitude of each frequency component.
Phase: The timing or position of each frequency component.
Here are some key principles to keep in mind:
FSA is a linear transformation, meaning that the input and output signals have the same amplitude and phase relationships.
The frequency spectrum is symmetric around the origin (0 Hz), but its often presented as an asymmetric plot for ease of visualization.
The total energy of the signal is preserved during FSA, meaning that the sum of the amplitudes of all frequency components equals the original signal.
Applications of Frequency Spectrum Analysis
FSA has numerous applications in various fields:
Telecommunications: FSA helps to understand and analyze communication signals, identifying patterns and anomalies.
Signal Processing: FSA is used to filter out noise from signals, compress data, and enhance image quality.
Data Compression: FSA can be applied to data compression algorithms, reducing the size of files while preserving their integrity.
Machine Learning: FSA is a fundamental component in many machine learning techniques, including feature extraction and dimensionality reduction.
Here are some more detailed bullet points on specific applications:
Financial Analysis
FSA helps to identify patterns and trends in financial data, such as stock prices or trading volumes.
It can be used to detect anomalies and outliers in financial time series.
FSA can also be applied to risk assessment and portfolio optimization.
Medical Imaging
FSA is used in medical imaging techniques like MRI and CT scans to reconstruct images of the body.
It helps to identify patterns and features in medical images, such as tumors or organs.
FSA can also be applied to image compression and denoising.
QA Section
Here are some additional questions and answers that provide more details about Frequency Spectrum Analysis:
Q:
What is the difference between Time Domain and Frequency Domain?
A: The time domain represents a signal in terms of its amplitude over time, while the frequency domain represents the same signal in terms of its constituent frequencies. FSA converts the time domain representation into the frequency domain.
Q:
How do I choose the correct window size for FSA?
A: Window size is crucial in FSA as it affects the resolution and accuracy of the analysis. A larger window size will provide better resolution but may introduce artifacts, while a smaller window size will be more precise but less accurate.
Q:
Can FSA handle non-linear signals?
A: Yes, FSA can be applied to non-linear signals by using techniques like the Hilbert Transform or the Wavelet Transform. These methods help to extract the underlying patterns and features from non-linear data.
Q:
How do I interpret the frequency spectrum plot?
A: The x-axis represents the frequency, while the y-axis represents the amplitude (or intensity) of each frequency component. Peaks in the plot indicate significant frequencies, which can be used to understand the signals characteristics.
Q:
Can FSA be used for real-time analysis?
A: Yes, FSA can be applied to real-time data streams by using techniques like online Fourier Transform or streaming algorithms. These methods allow for continuous monitoring and analysis of signals in real-time.
In conclusion, Frequency Spectrum Analysis is a powerful tool with numerous applications in various fields. By understanding the key concepts and principles behind FSA, you can unlock its potential and apply it to your own data analysis projects.