Root Cause Analysis (RCA) for Pressure Vessel Failures: A Comprehensive Approach
Pressure vessel failures can have devastating consequences, including loss of life, significant financial losses, and damage to equipment. In order to prevent such incidents from occurring in the future, it is essential to conduct a thorough root cause analysis (RCA). RCA is a systematic approach to identifying the underlying causes of a failure or incident, with the ultimate goal of preventing similar failures from happening again.
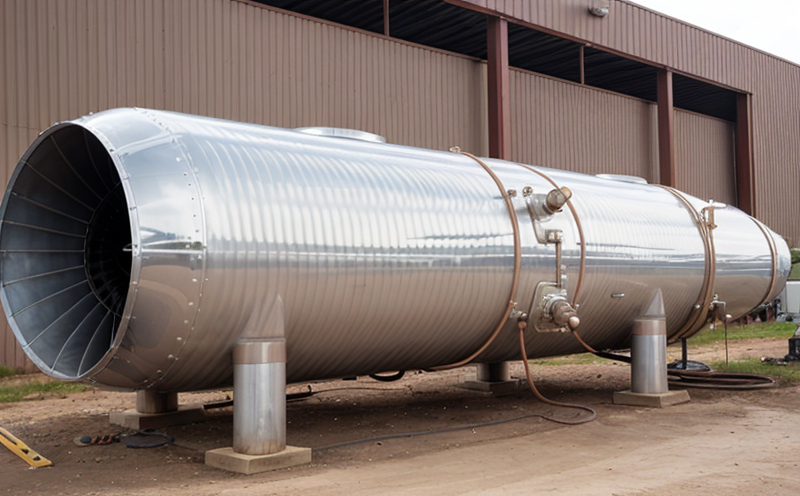
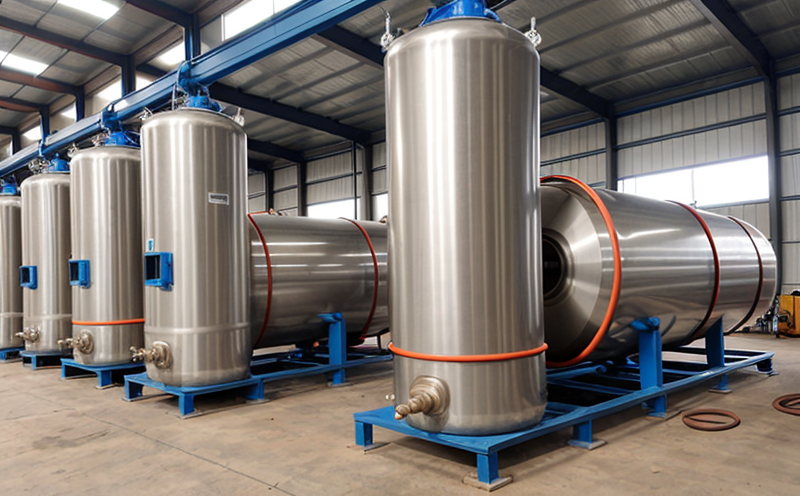
A pressure vessel is a container designed to withstand internal pressure during its service life. It can be made of various materials such as steel, aluminum, or other alloys. Pressure vessels are used in a wide range of industries, including oil and gas, chemical processing, power generation, and transportation. Despite their importance, pressure vessels are prone to failure due to various factors.
Causes of Pressure Vessel Failures
Pressure vessel failures can be attributed to several factors, including:
Design errors
Manufacturing defects
Material selection issues
Operating conditions
Maintenance practices
Inspection and testing protocols
Design Errors
Design errors can lead to pressure vessel failures. Some common design errors include:
Incorrect stress analysis
Inadequate thickness calculations
Insufficient consideration of corrosive environments
Failure to account for thermal expansion and contraction
Manufacturing Defects
Manufacturing defects can also contribute to pressure vessel failures. Some common manufacturing defects include:
Welding defects, such as porosity or lack of fusion
Material irregularities, such as inclusions or contamination
Inadequate testing or inspection procedures
Material Selection Issues
Material selection is a critical aspect of pressure vessel design and construction. The choice of material can significantly impact the performance and reliability of the vessel. Some common material selection issues include:
Inadequate consideration of corrosion resistance
Failure to account for high-temperature applications
Insufficient knowledge of material properties and limitations
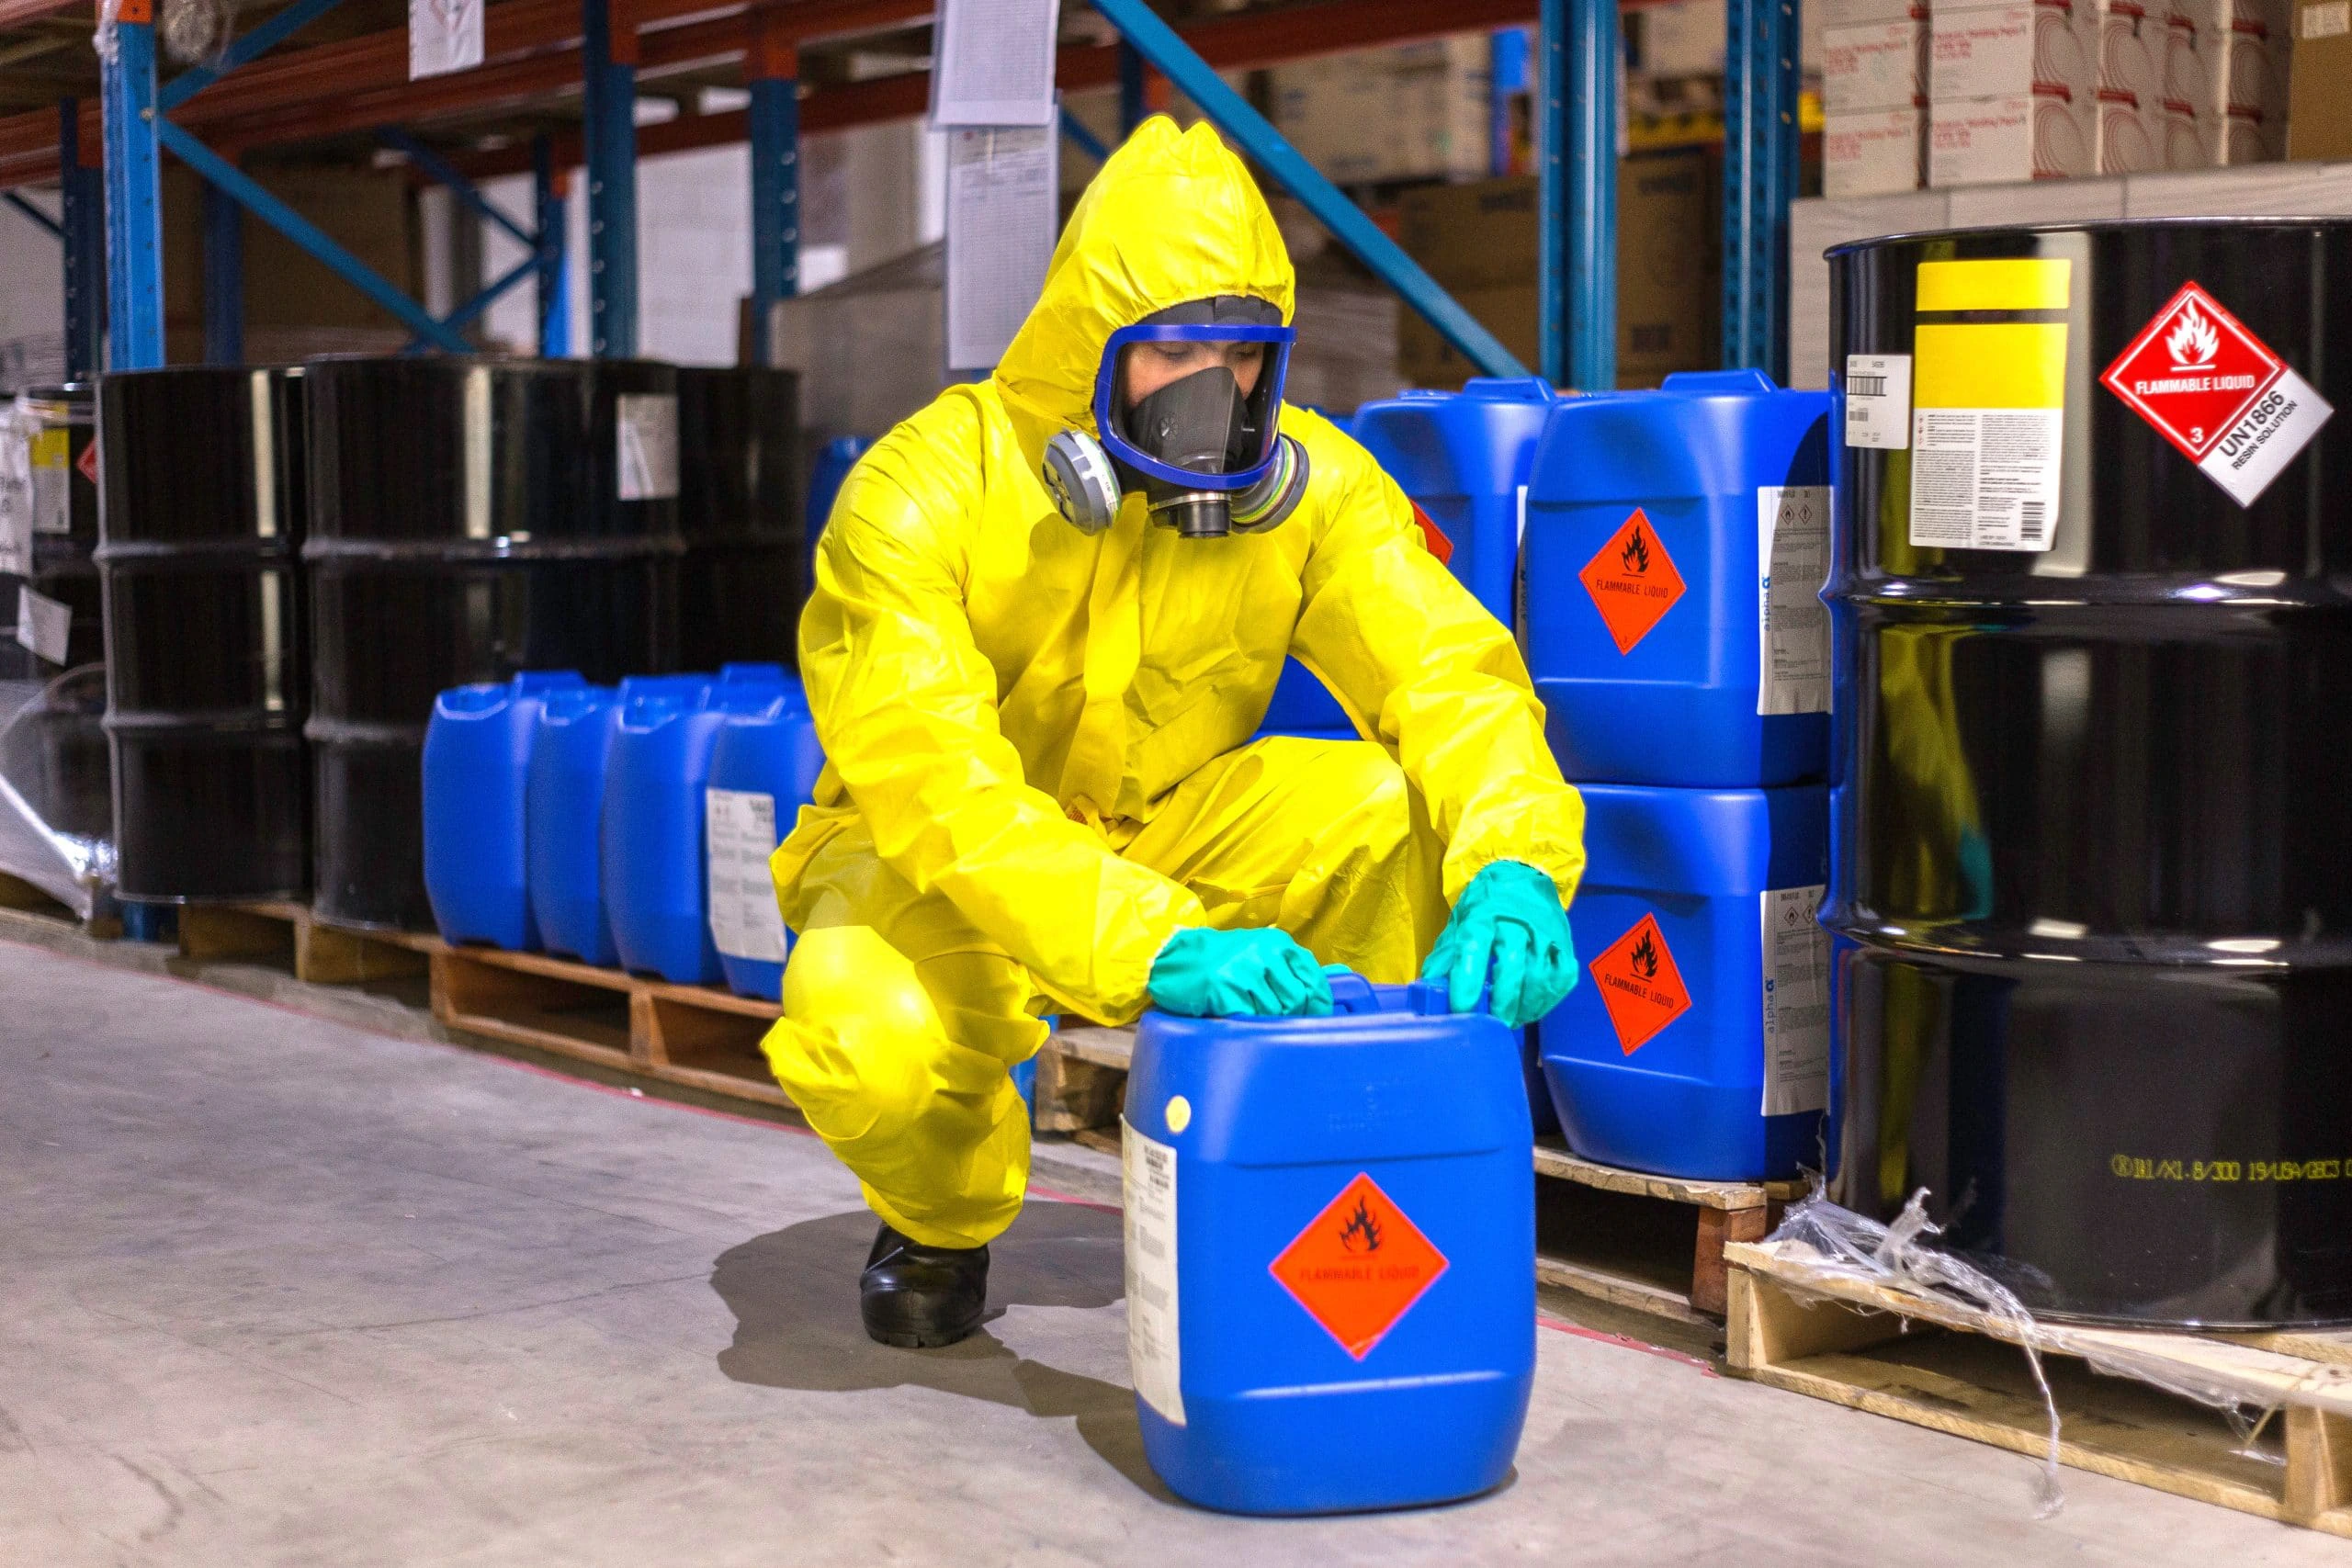
Operating Conditions
Pressure vessels are subject to various operating conditions, including temperature, pressure, and flow rates. Deviations from design specifications or operating requirements can lead to failure.
Maintenance Practices
Regular maintenance is essential to ensure the continued integrity of a pressure vessel. Some common maintenance practices that can contribute to failures include:
Inadequate cleaning and inspection procedures
Failure to perform scheduled maintenance tasks
Insufficient training of maintenance personnel
Inspection and Testing Protocols
Inspection and testing protocols are crucial in ensuring the reliability of pressure vessels. Some common inspection and testing issues include:
Inadequate frequency or timing of inspections
Insufficient knowledge of inspection techniques or procedures
Failure to address potential defects or anomalies
Root Cause Analysis Techniques
Several root cause analysis (RCA) techniques can be used to identify the underlying causes of a pressure vessel failure. Some common RCA techniques include:
Fishbone diagramming
Fault tree analysis
Ishikawa diagrams
Pareto charts
Statistical process control
Fishbone Diagramming
A fishbone diagram, also known as an Ishikawa diagram, is a visual tool used to identify the possible causes of a problem. It consists of a central head representing the problem, and branches radiating from it, representing the various possible causes.
Step 1: Identify the Problem
The first step in creating a fishbone diagram is to clearly define the problem or failure.
Step 2: Brainstorm Possible Causes
A team of experts should brainstorm possible causes of the problem. These can include design errors, manufacturing defects, material selection issues, operating conditions, maintenance practices, and inspection and testing protocols.
Step 3: Categorize Causes
The possible causes identified in step 2 are categorized into groups such as people, procedures, equipment, materials, environment, and internal.
Fault Tree Analysis
Fault tree analysis (FTA) is a systematic approach to identifying the possible causes of a failure. It uses a logic diagram to represent the relationships between potential failures and their underlying causes.
Step 1: Identify the Failure
The first step in conducting an FTA is to clearly define the failure or problem.
Step 2: Develop a Fault Tree
A fault tree is developed by identifying the possible causes of the failure, including design errors, manufacturing defects, material selection issues, operating conditions, maintenance practices, and inspection and testing protocols.
Step 3: Analyze the Fault Tree
The fault tree is analyzed to identify the most likely causes of the failure.
Ishikawa Diagrams
An Ishikawa diagram is a visual tool used to identify the possible causes of a problem. It consists of a central head representing the problem, and branches radiating from it, representing the various possible causes.
Step 1: Identify the Problem
The first step in creating an Ishikawa diagram is to clearly define the problem or failure.
Step 2: Brainstorm Possible Causes
A team of experts should brainstorm possible causes of the problem. These can include design errors, manufacturing defects, material selection issues, operating conditions, maintenance practices, and inspection and testing protocols.
Step 3: Categorize Causes
The possible causes identified in step 2 are categorized into groups such as people, procedures, equipment, materials, environment, and internal.
Pareto Charts
A Pareto chart is a statistical tool used to identify the most common causes of a problem. It consists of bars representing the frequency or occurrence of each cause, with the longest bar indicating the most common cause.
Step 1: Collect Data
Data on the possible causes of the failure is collected and analyzed.
Step 2: Rank Causes
The possible causes are ranked in order of their frequency or occurrence.
Step 3: Identify the Most Common Cause
The Pareto chart is used to identify the most common cause of the failure.
Statistical Process Control
Statistical process control (SPC) is a technique used to monitor and control processes to ensure that they remain within specified limits. SPC can be used to identify potential causes of pressure vessel failures.
Step 1: Establish Limits
The first step in implementing SPC is to establish the limits for each parameter.
Step 2: Monitor Parameters
Parameters such as temperature, pressure, and flow rates are continuously monitored to ensure that they remain within specified limits.
Step 3: Take Corrective Action
When a parameter exceeds its limit, corrective action is taken to bring it back within the specified range.
QA Section
Q: What is root cause analysis?
A: Root cause analysis (RCA) is a systematic approach to identifying the underlying causes of a failure or incident. The ultimate goal of RCA is to prevent similar failures from occurring in the future.
Q: Why is it essential to conduct an RCA for pressure vessel failures?
A: Conducting an RCA for pressure vessel failures helps identify the underlying causes of the failure, enabling corrective actions to be taken to prevent similar incidents from happening again.
Q: What are some common causes of pressure vessel failures?
A: Some common causes of pressure vessel failures include design errors, manufacturing defects, material selection issues, operating conditions, maintenance practices, and inspection and testing protocols.
Q: How do I create a fishbone diagram for root cause analysis?
A: To create a fishbone diagram, identify the problem or failure, brainstorm possible causes, categorize causes into groups such as people, procedures, equipment, materials, environment, and internal, and use the diagram to visualize the relationships between potential failures and their underlying causes.
Q: What is fault tree analysis (FTA)?
A: Fault tree analysis (FTA) is a systematic approach to identifying the possible causes of a failure. It uses a logic diagram to represent the relationships between potential failures and their underlying causes.
Q: How do I implement statistical process control (SPC) for pressure vessel maintenance?
A: To implement SPC, establish limits for each parameter, monitor parameters continuously, and take corrective action when a parameter exceeds its limit.